> ## Documentation Index
> Fetch the complete documentation index at: https://help.captureiq.ai/llms.txt
> Use this file to discover all available pages before exploring further.
# CaptureIQ - Detailed Form Insights
Once your form starts collecting responses, CaptureIQ gives you a powerful analytics dashboard to understand your audience and their behavior. You’ll find these insights in the **Results → Insights** section of your form.
Here’s what you’ll see inside:
### **Filters**
At the very top, you’ll find **filters** that let you customize how you want to visualize your analytics. You can adjust them to focus on specific time periods or audience segments.
### **The Big Picture**
This gives you an at-a-glance summary of your form’s performance. It includes:
* **Views** – How many people visited your form.
* **Starts** – How many visitors actually started filling out your form.
* **Submissions** – Total submitted responses.
* **Completion Rate** – The percentage of users who started and submitted the form.
* **Average Time to Complete** – How long it takes on average for someone to finish the form.
Example:
* Views: 14
* Starts: 14
* Submissions: 14
* Completion Rate: 100%
* Avg. Time to Complete: 00:31
 ### **Total Submissions Over Time**
The second chart shows **submissions by day**, giving you a clear view of how your form performs over time. This helps identify trends, spikes, or slow periods.
### **Referrals**
This section breaks down where your form traffic is coming from—such as **Direct, Facebook, LinkedIn, X (Twitter), and more.**
### **Total Submissions Over Time**
The second chart shows **submissions by day**, giving you a clear view of how your form performs over time. This helps identify trends, spikes, or slow periods.
### **Referrals**
This section breaks down where your form traffic is coming from—such as **Direct, Facebook, LinkedIn, X (Twitter), and more.**
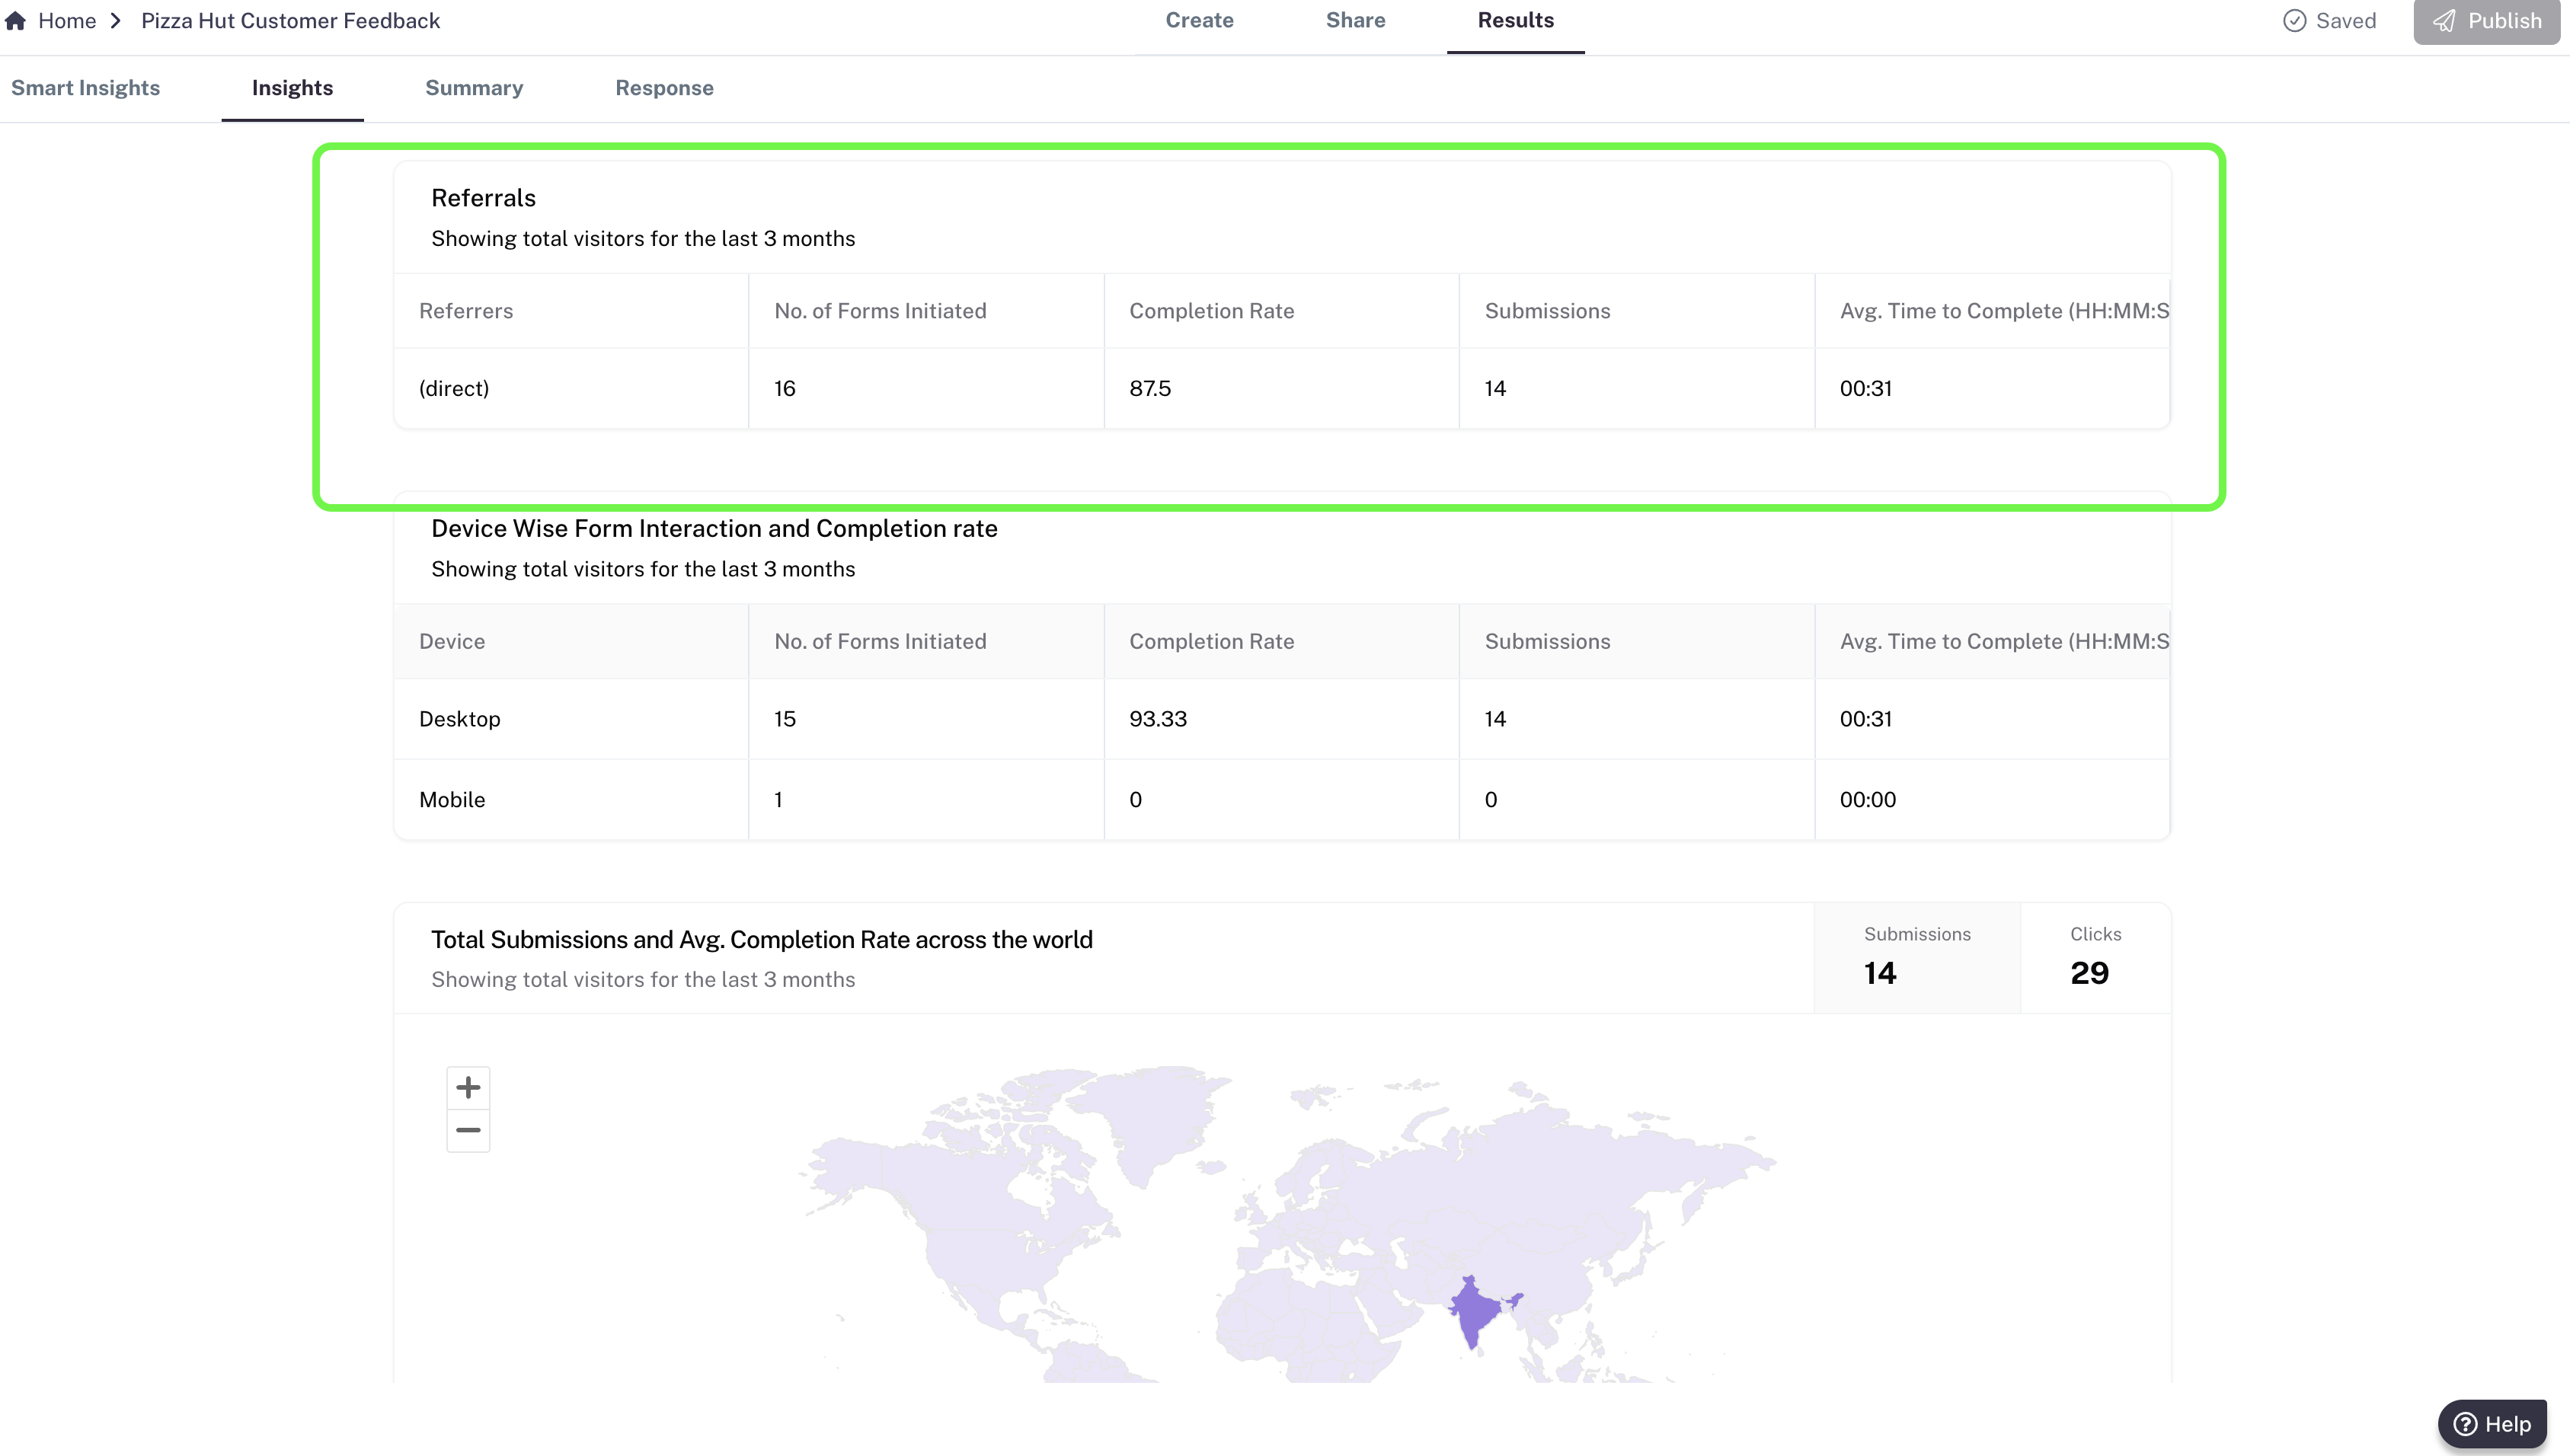 You’ll see:
* **No. of Forms Initiated**
* **Completion Rate**
* **Submissions**
* **Avg. Time to Complete**
This helps you compare platforms and decide which channel brings the highest-quality responses.
### **Device Insights**
Understand how your audience interacts with your form across different devices: **Desktop, Mobile, Tablet (iPad)**.
For each device, you’ll see:
* No. of Forms Initiated
* Completion Rate
* Submissions
* Avg. Time to Complete
This helps you understand your ICP (Ideal Customer Profile) distribution and optimize future forms accordingly.
You’ll see:
* **No. of Forms Initiated**
* **Completion Rate**
* **Submissions**
* **Avg. Time to Complete**
This helps you compare platforms and decide which channel brings the highest-quality responses.
### **Device Insights**
Understand how your audience interacts with your form across different devices: **Desktop, Mobile, Tablet (iPad)**.
For each device, you’ll see:
* No. of Forms Initiated
* Completion Rate
* Submissions
* Avg. Time to Complete
This helps you understand your ICP (Ideal Customer Profile) distribution and optimize future forms accordingly.
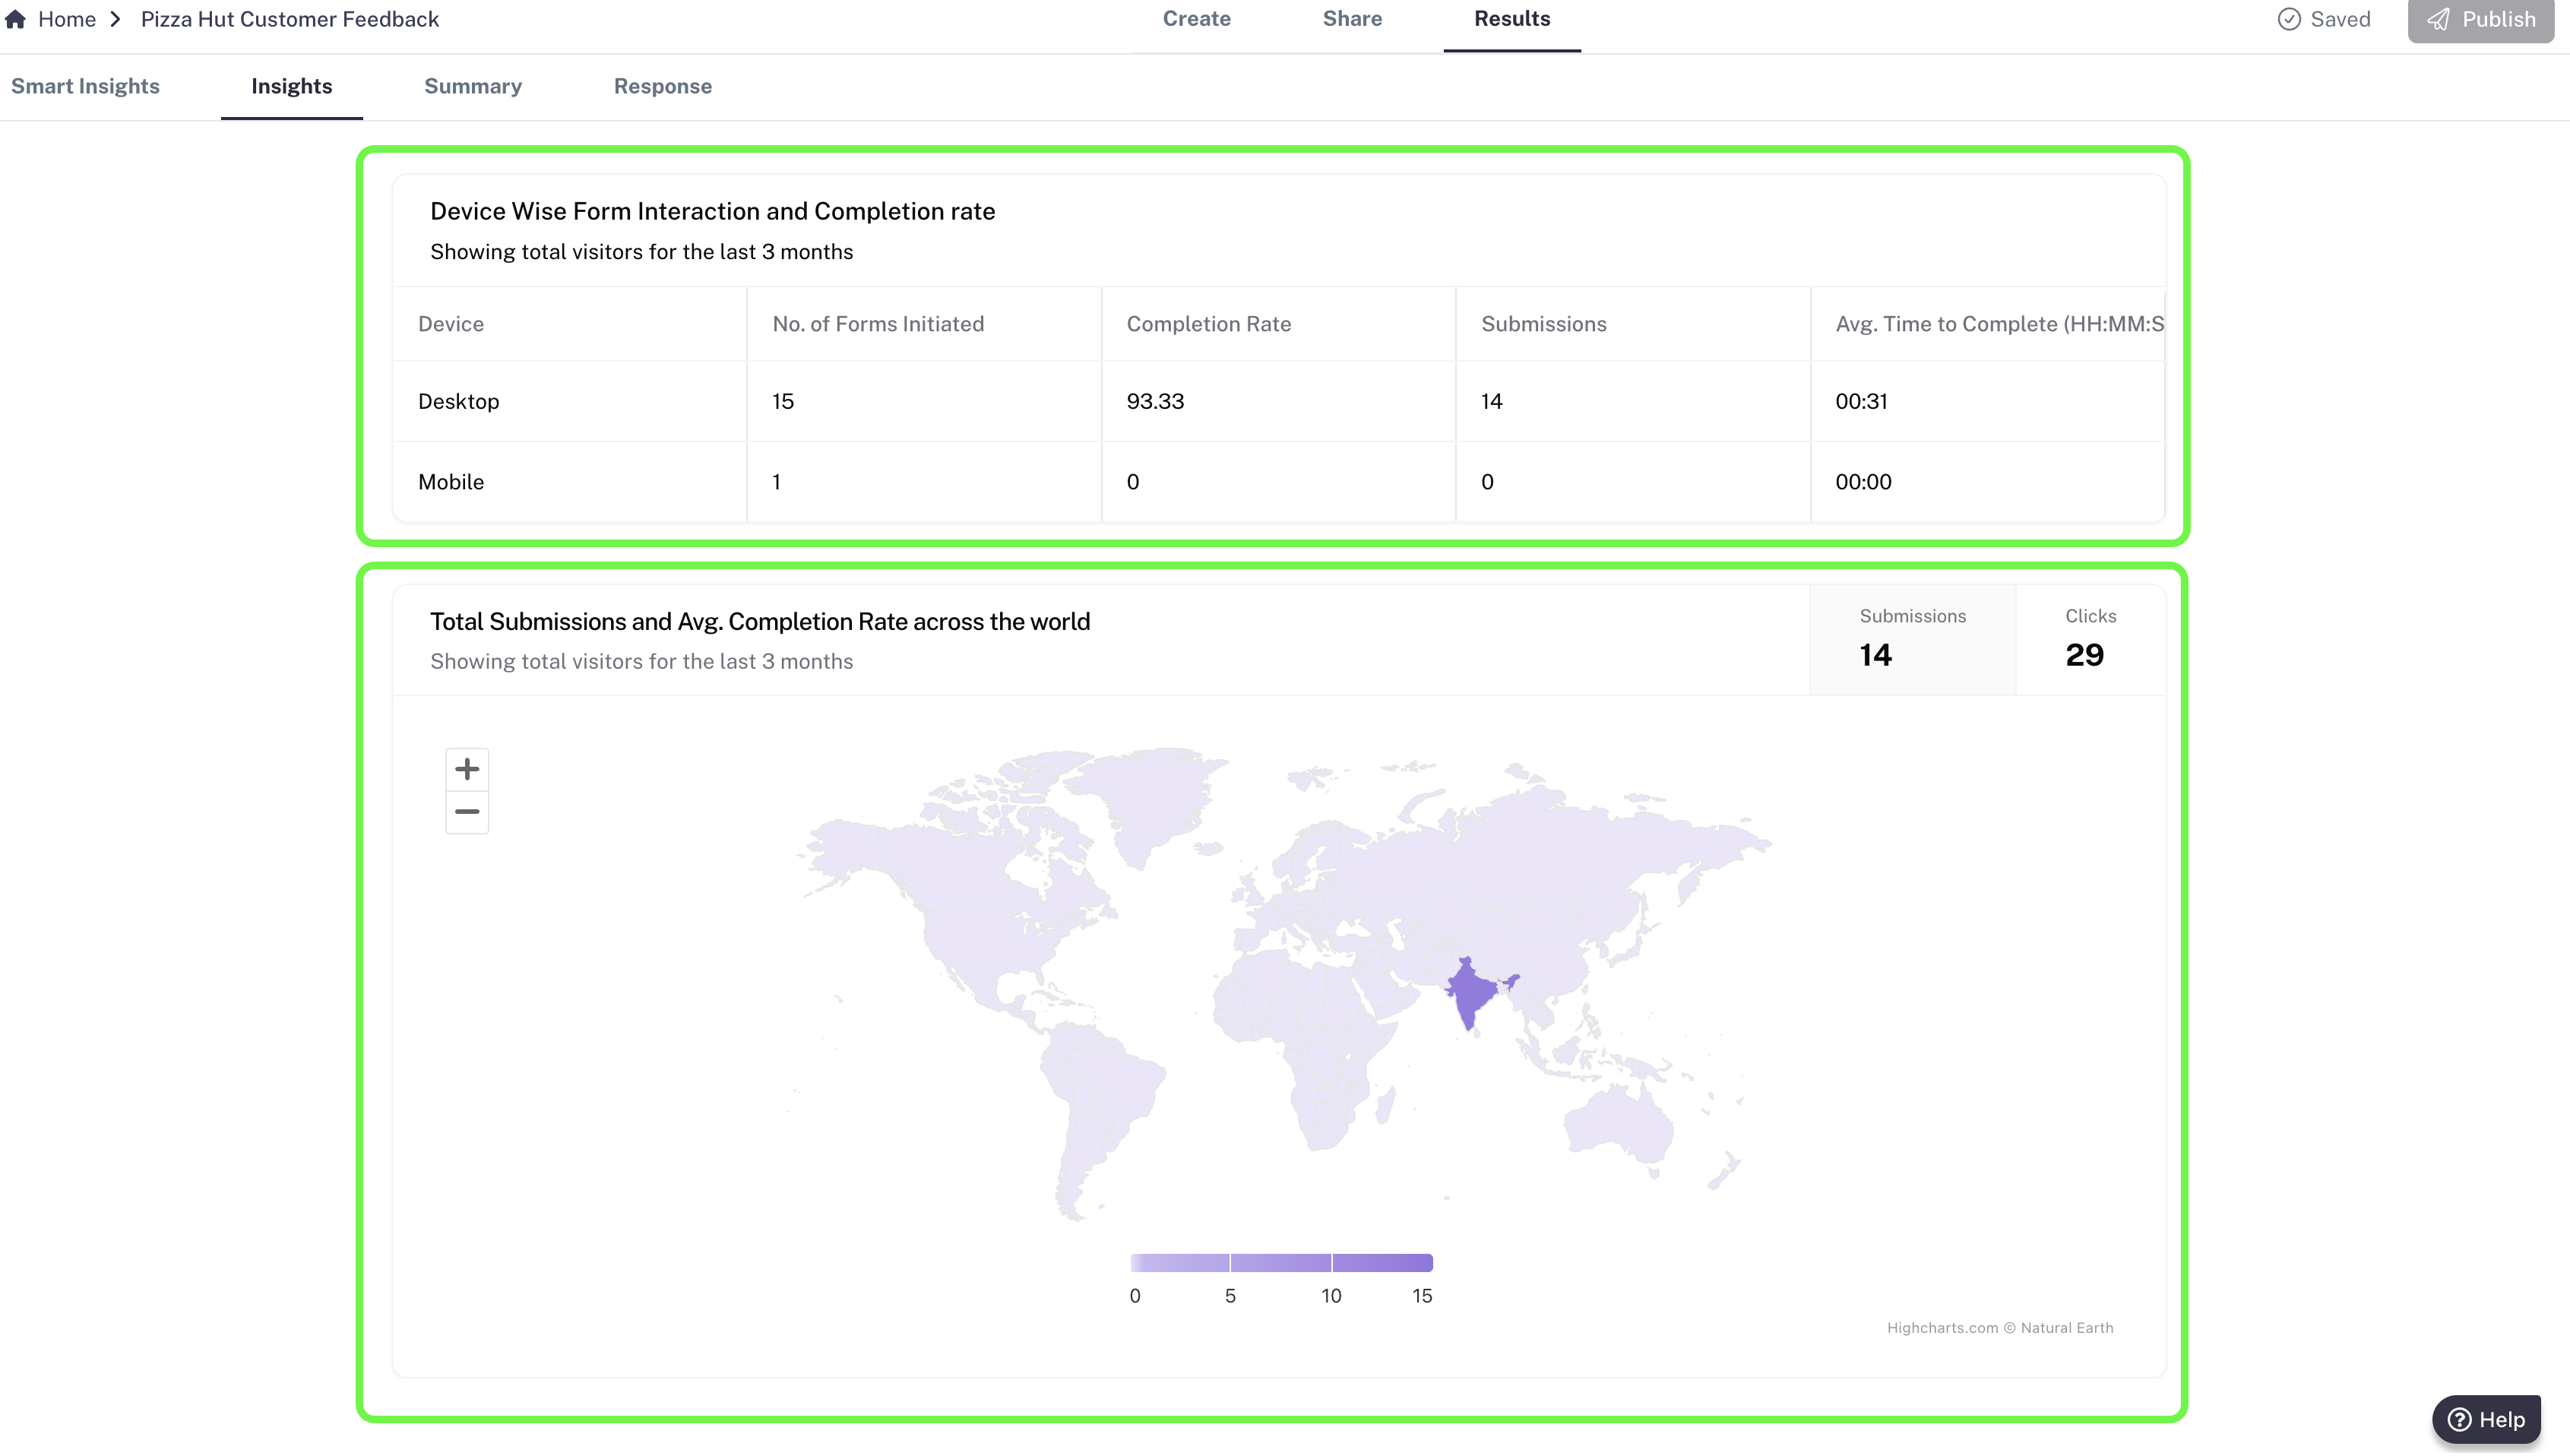 ### **Global Reach**
Finally, you’ll see a **world map visualization** showing submissions and average completion rates across different countries. This gives you a clear idea of where your audience is located and how your form is performing globally.
With these insights, you can make data-driven decisions, optimize your forms, and improve engagement across different platforms, devices, and geographies.
### **Global Reach**
Finally, you’ll see a **world map visualization** showing submissions and average completion rates across different countries. This gives you a clear idea of where your audience is located and how your form is performing globally.
With these insights, you can make data-driven decisions, optimize your forms, and improve engagement across different platforms, devices, and geographies.