> ## Documentation Index
> Fetch the complete documentation index at: https://help.captureiq.ai/llms.txt
> Use this file to discover all available pages before exploring further.
# CaptureIQ – question-by-question summary
Once your form is published and starts collecting responses, CaptureIQ provides not only overall analytics but also **question-by-question summary**. This helps you dive deeper into how each question performs and how your respondents are interacting with them.
### **Where to find it**
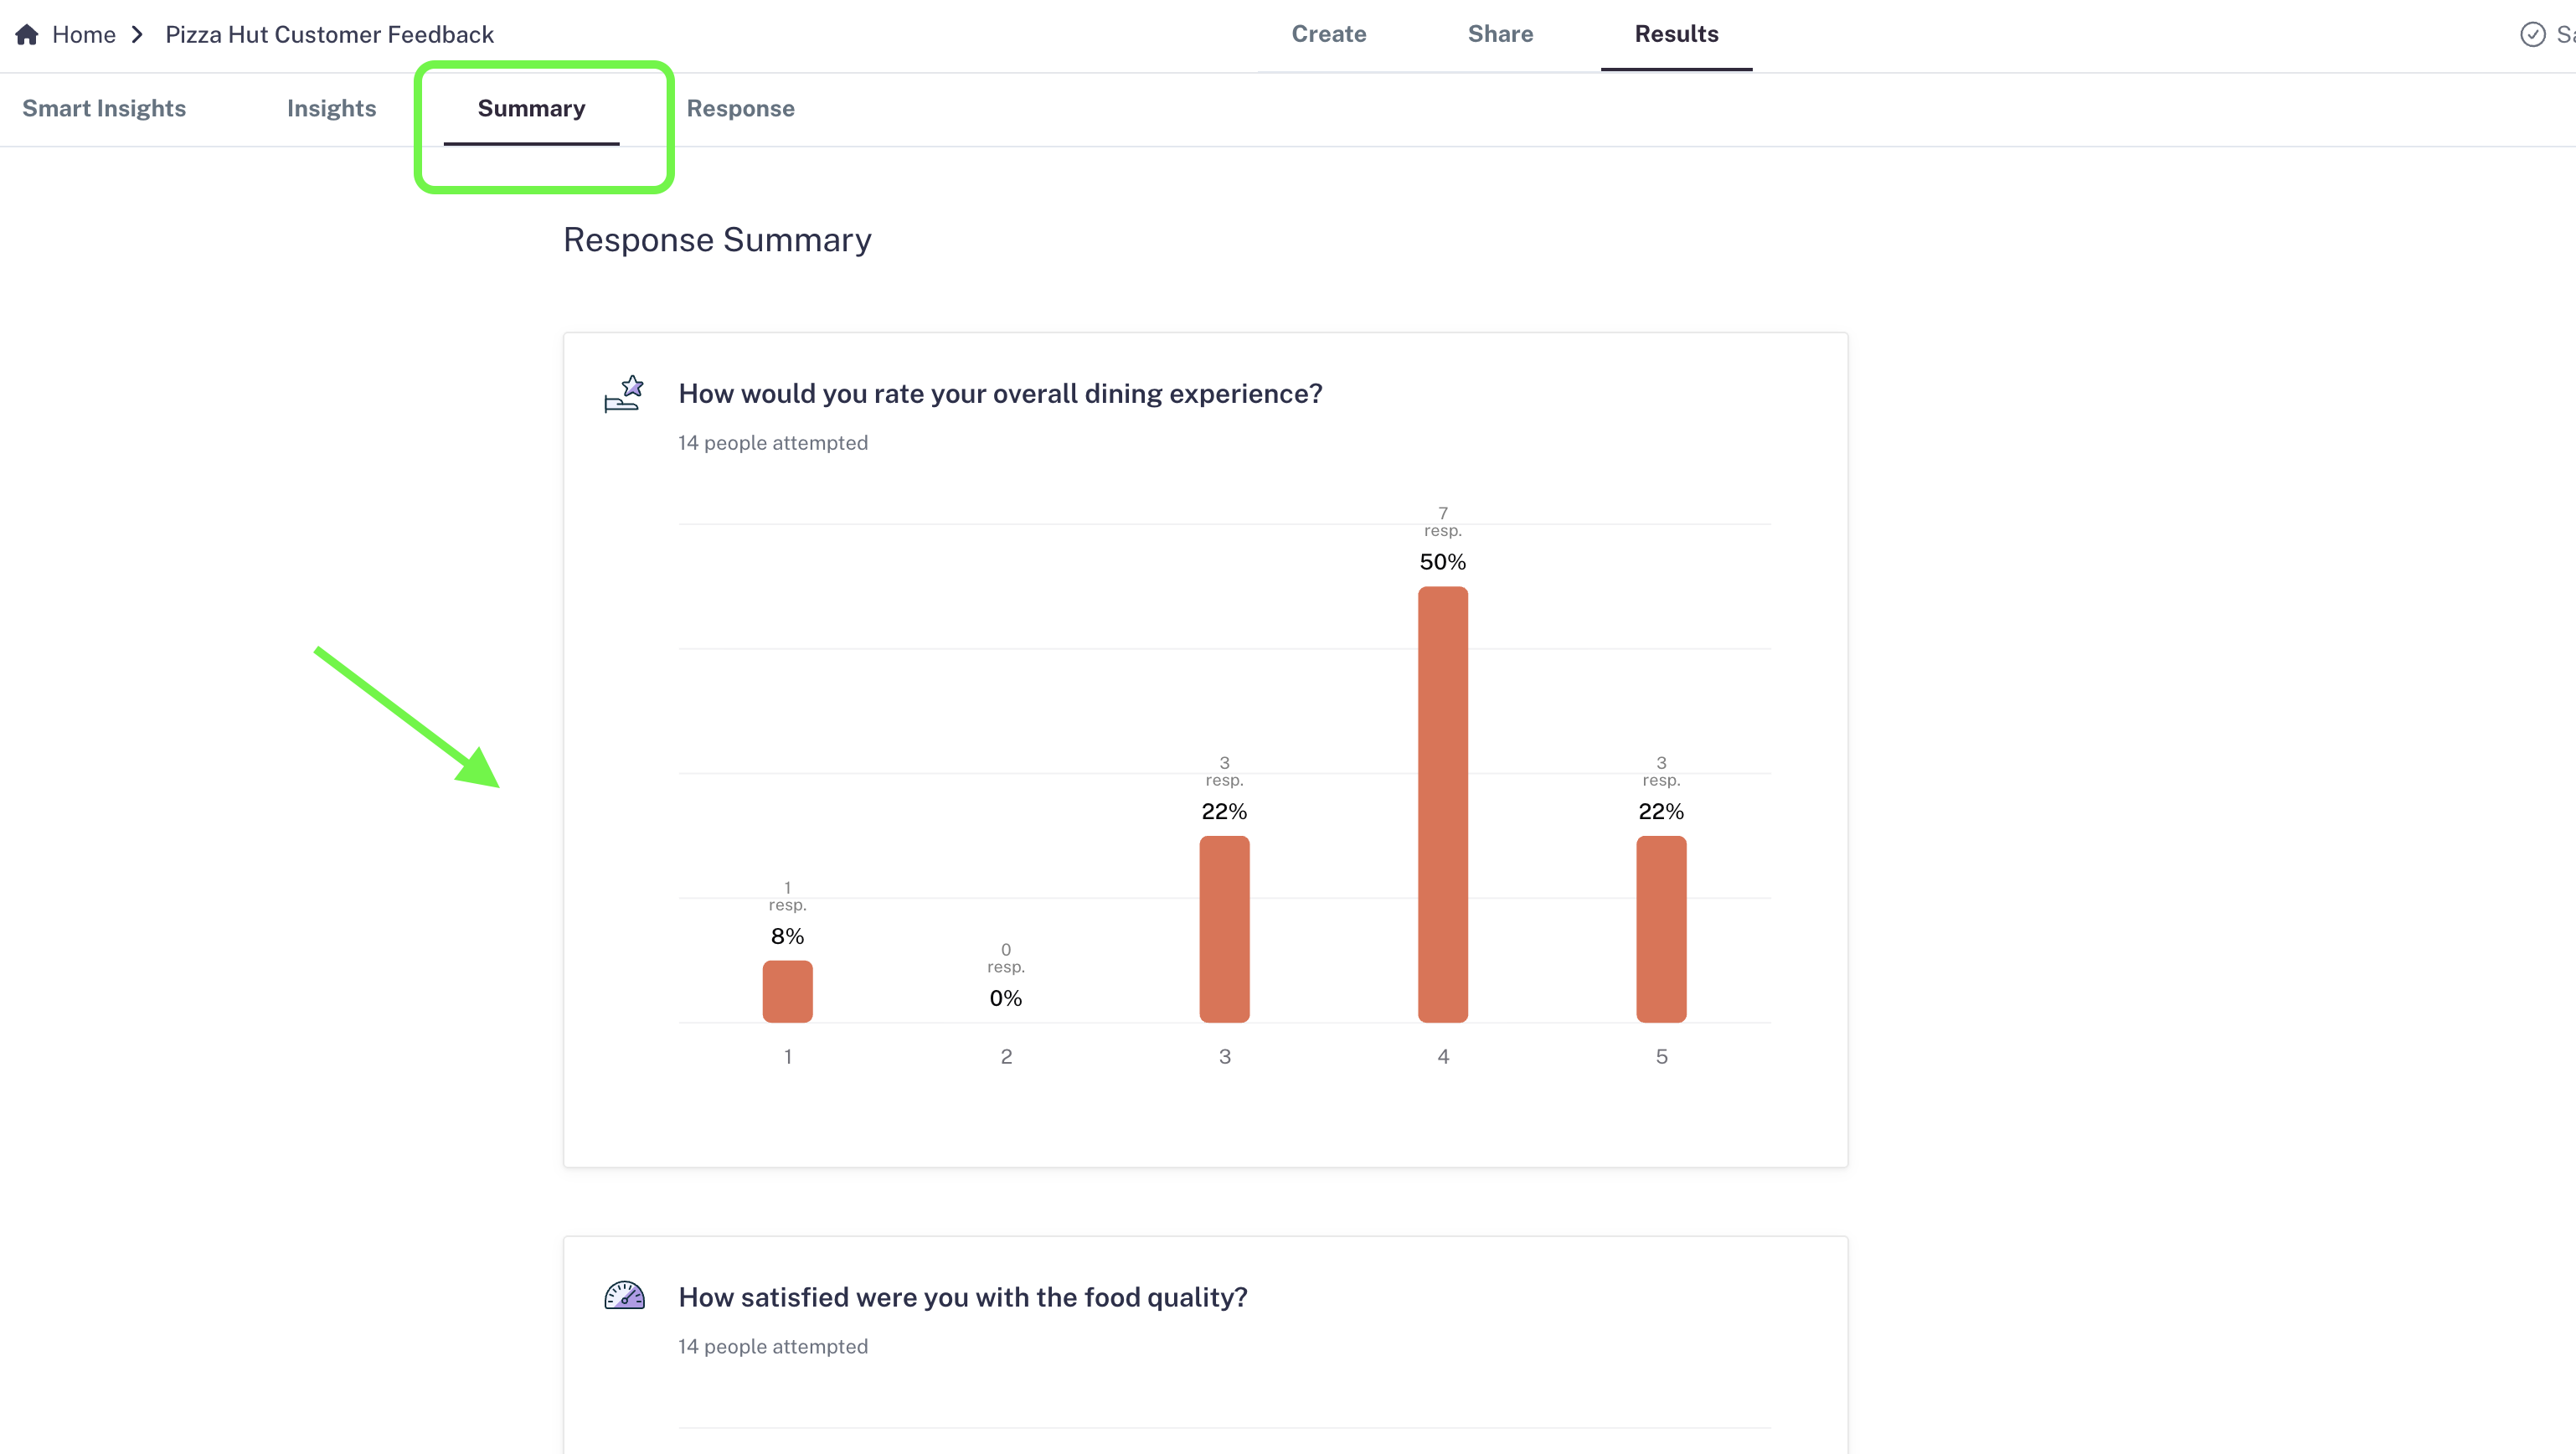
1. Go to your published form.
2. Navigate to **Results** tab.
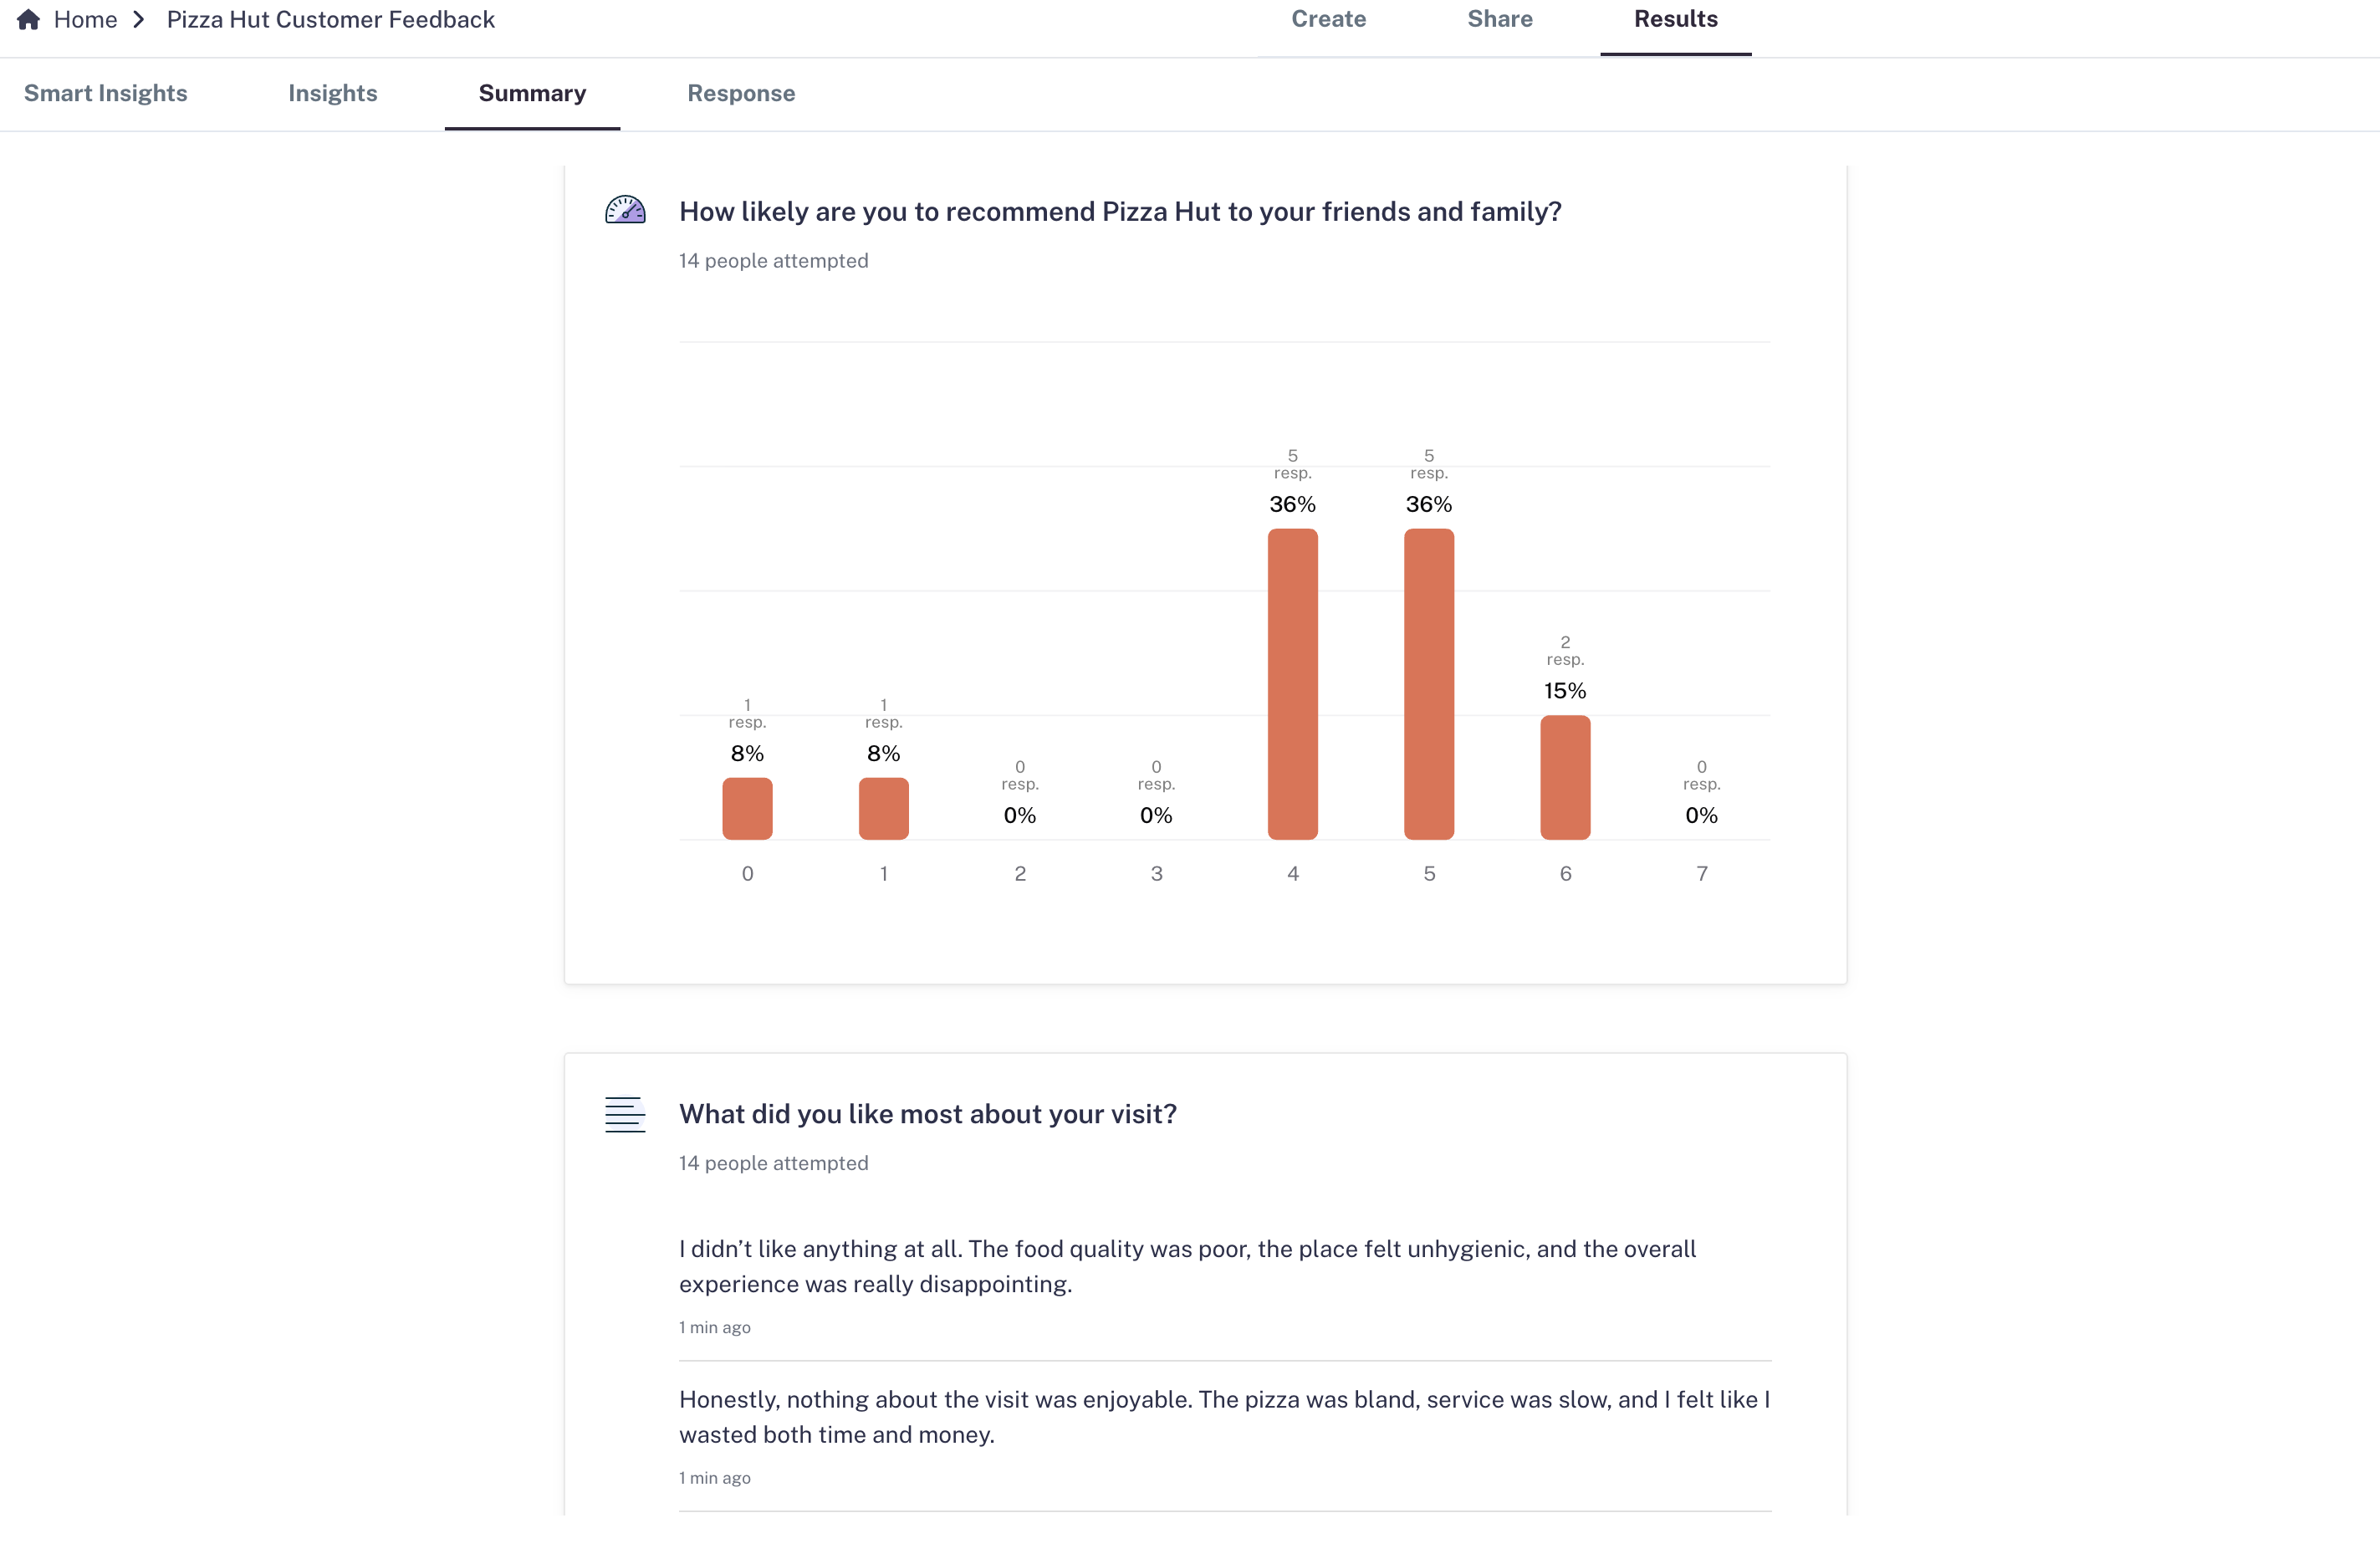
3. Open the **Summary** tab under Results.
4. Here, you’ll find detailed insights for each field or question in your form.
 ### **What you can see**
* **Rating questions**: View the exact distribution. For example, you might discover that 50% of respondents rated you 4 stars, 20% gave 5 stars, and the rest distributed lower.
* **Multiple-choice questions**: Identify which options are most and least selected, helping you spot trends in preferences.
* **Text fields (short/long answers)**: Scroll through responses directly inside the dashboard to see detailed feedback, ideas, or comments.
* **Drop-downs**: Analyze how often each choice is picked to refine your options.
### **What you can see**
* **Rating questions**: View the exact distribution. For example, you might discover that 50% of respondents rated you 4 stars, 20% gave 5 stars, and the rest distributed lower.
* **Multiple-choice questions**: Identify which options are most and least selected, helping you spot trends in preferences.
* **Text fields (short/long answers)**: Scroll through responses directly inside the dashboard to see detailed feedback, ideas, or comments.
* **Drop-downs**: Analyze how often each choice is picked to refine your options.
 ### **Real-world use cases**
* **Product feedback** → Understand which features customers love most or where improvements are needed.
* **Customer satisfaction** → Track ratings and reviews to measure performance over time.
* **Market research** → See which preferences dominate in multiple-choice questions.
* **Lead forms** → Spot common themes in open-text responses to better qualify leads.
Question-by-question summary help you move beyond surface-level metrics and give you **actionable data** to improve your forms, products, and decision-making.
### **Real-world use cases**
* **Product feedback** → Understand which features customers love most or where improvements are needed.
* **Customer satisfaction** → Track ratings and reviews to measure performance over time.
* **Market research** → See which preferences dominate in multiple-choice questions.
* **Lead forms** → Spot common themes in open-text responses to better qualify leads.
Question-by-question summary help you move beyond surface-level metrics and give you **actionable data** to improve your forms, products, and decision-making.