
How to Access Smart Analytics
- Go to your form’s editor Results tab.
- Navigate to the Smart Insights section.
- The first time you open this section for a form, the page will be empty, waiting for you to generate insights.
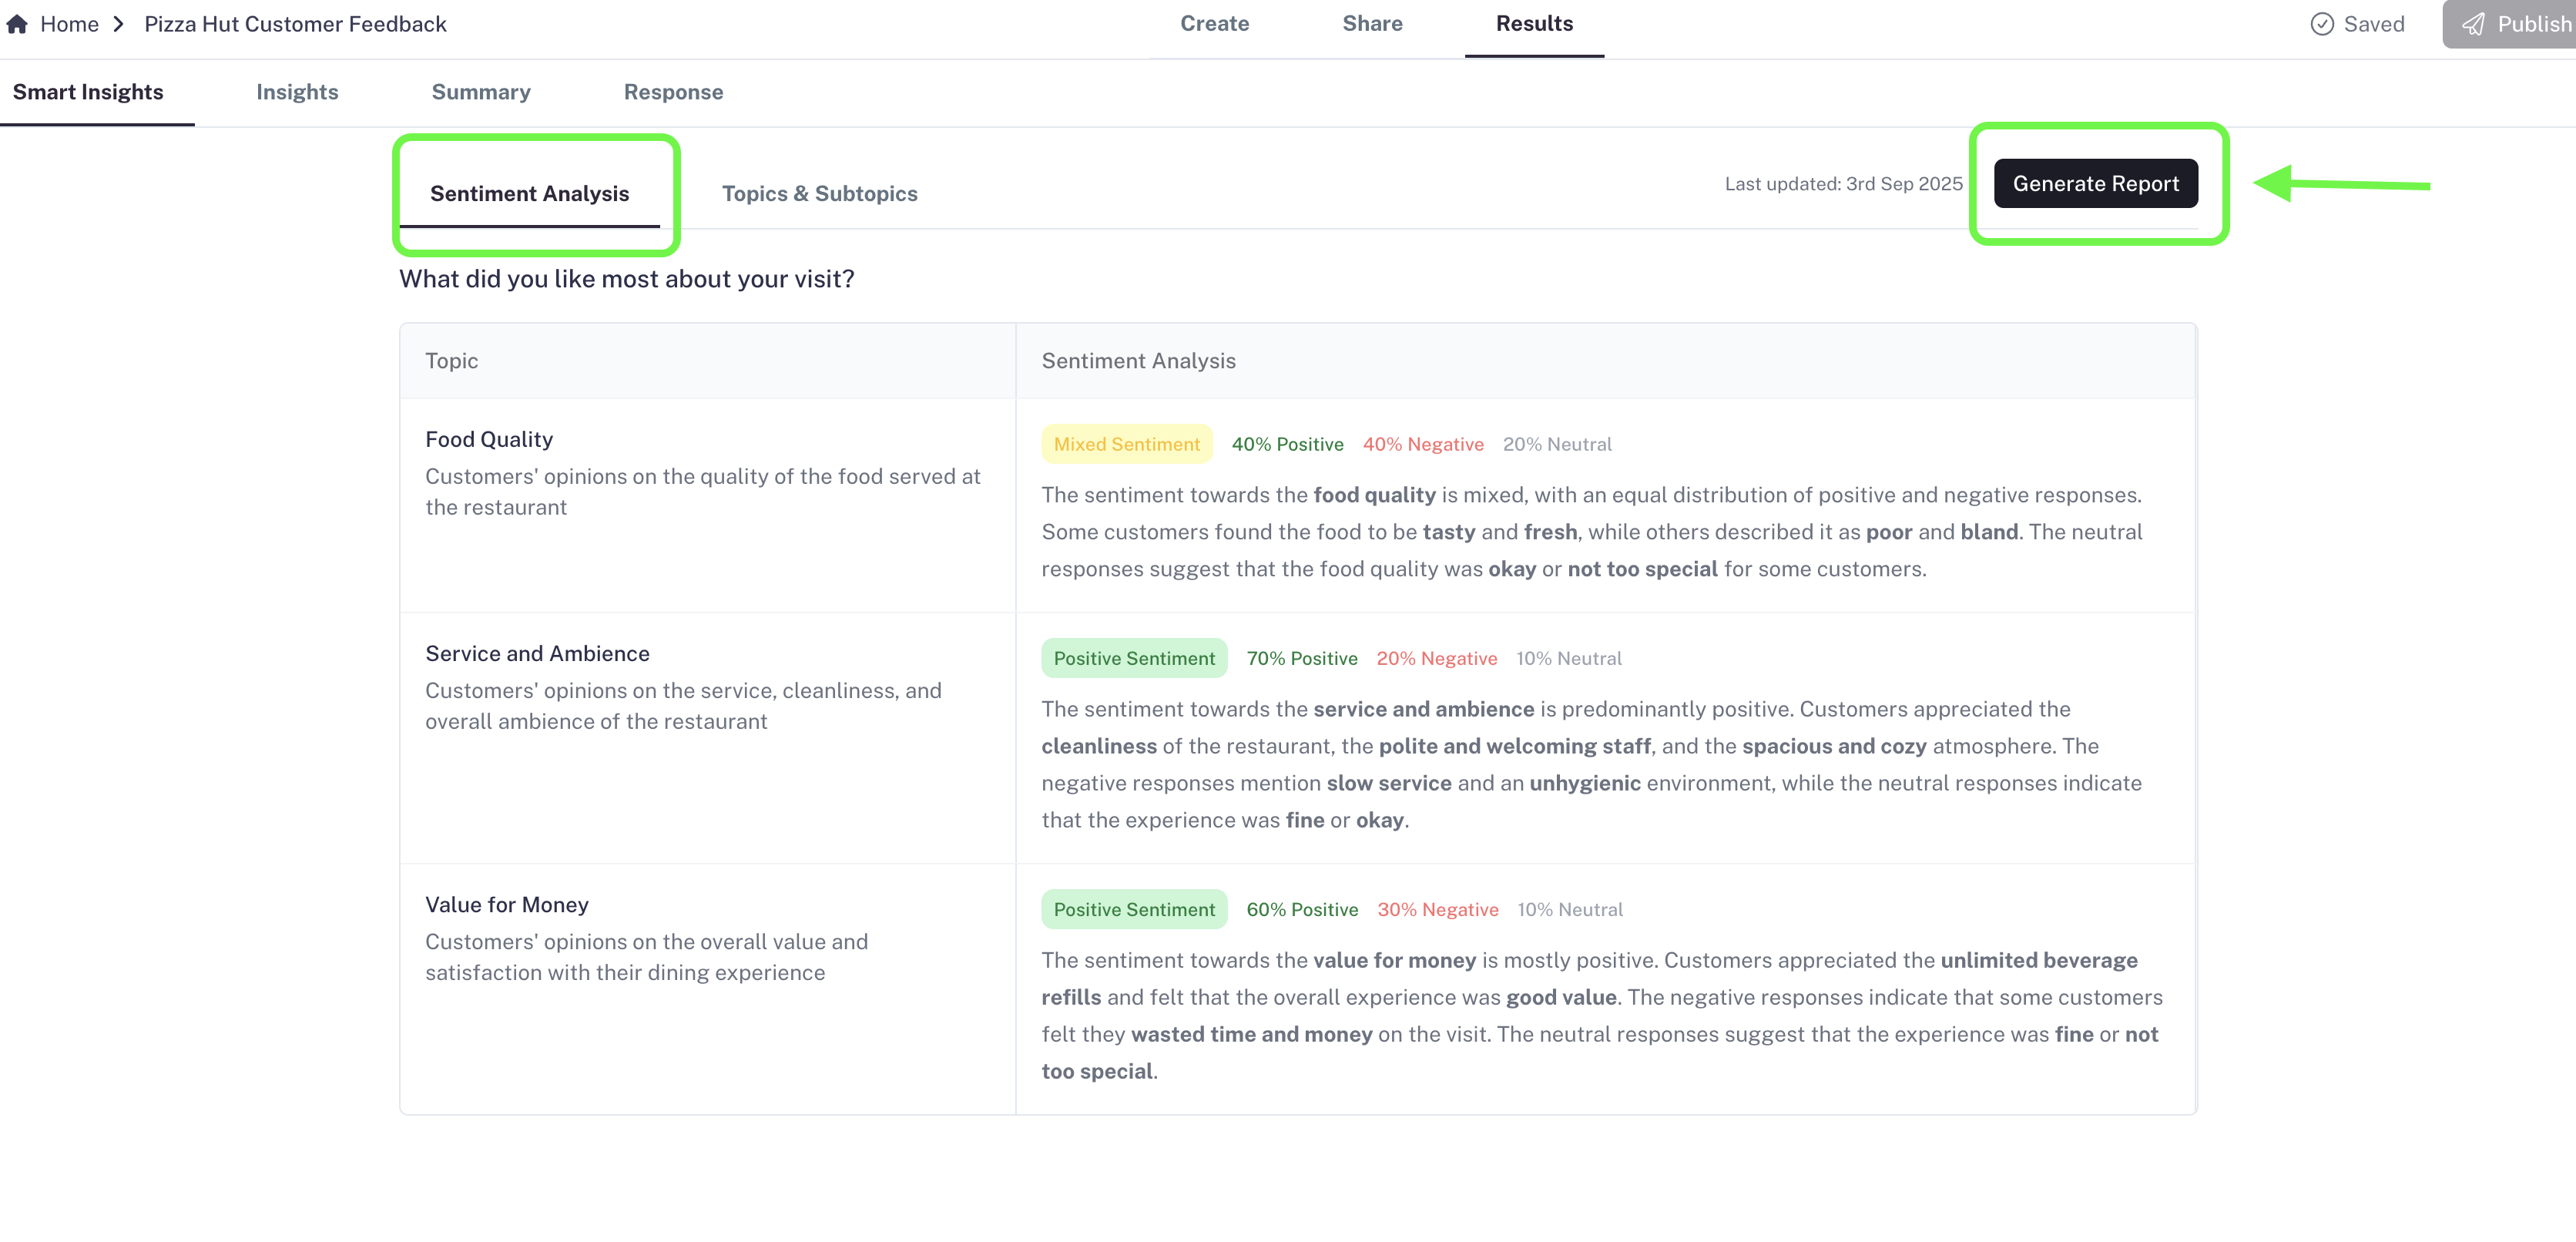
- On the top-right corner, you’ll see a button: Generate Report.
- Click this button to start processing your responses.
- Based on response volume, the report generation may take:
- 15–20 seconds for around 10–20 responses.
- Up to 15 minutes for a few hundred responses.
Important Notes
- Once you press Generate Report, the button will stay disabled for 24 hours. After 24 hours, you can press it again to refresh the analytics with the latest responses.
- At present, the system analyzes up to the latest 500 responses for Smart Analytics.
What’s Inside Smart Analytics?
Smart Analytics is divided into three parts:- Sentiment Analysis
- Topic & Subtopic Analysis
- Ask AI (read here)
Both Sentiment Analysis and Topic & Subtopic Analysis focus only on open-ended responses (Long Text and Short Text fields).
1. Sentiment Analysis
The Sentiment Analysis section is designed to help you quickly understand how your audience feels about the most frequently mentioned topics in your form responses.
- Field Selection: The AI automatically chooses one of your text fields to analyze, giving priority to Long Text fields (like feedback or survey questions). If there’s no Long Text field, it will consider Short Text fields.
-
Layout of the Section:
Once the insights are ready, you’ll see:
- The form question displayed clearly at the top.
- A table with two main columns:
- Topic: The key subjects that your respondents mentioned most often.
- Sentiment Analysis: The AI’s breakdown of how respondents feel about each topic (positive, negative, or neutral).
-
Value for You:
This analysis condenses potentially hundreds of text responses into a few clear themes, each tagged with sentiment.
- Example: In a restaurant survey, if many respondents mention food quality, this becomes a topic. The AI then shows whether most people discussed it positively (e.g., “loved the flavors”), negatively (e.g., “food was cold”), or neutrally.
Instead of spending hours reading line by line, you get a bird’s-eye view of customer emotions around the most important issues.
2. Topic & Subtopic Analysis
The Topic & Subtopic Analysis section goes one step deeper than sentiment analysis, helping you unpack responses into layers of insights.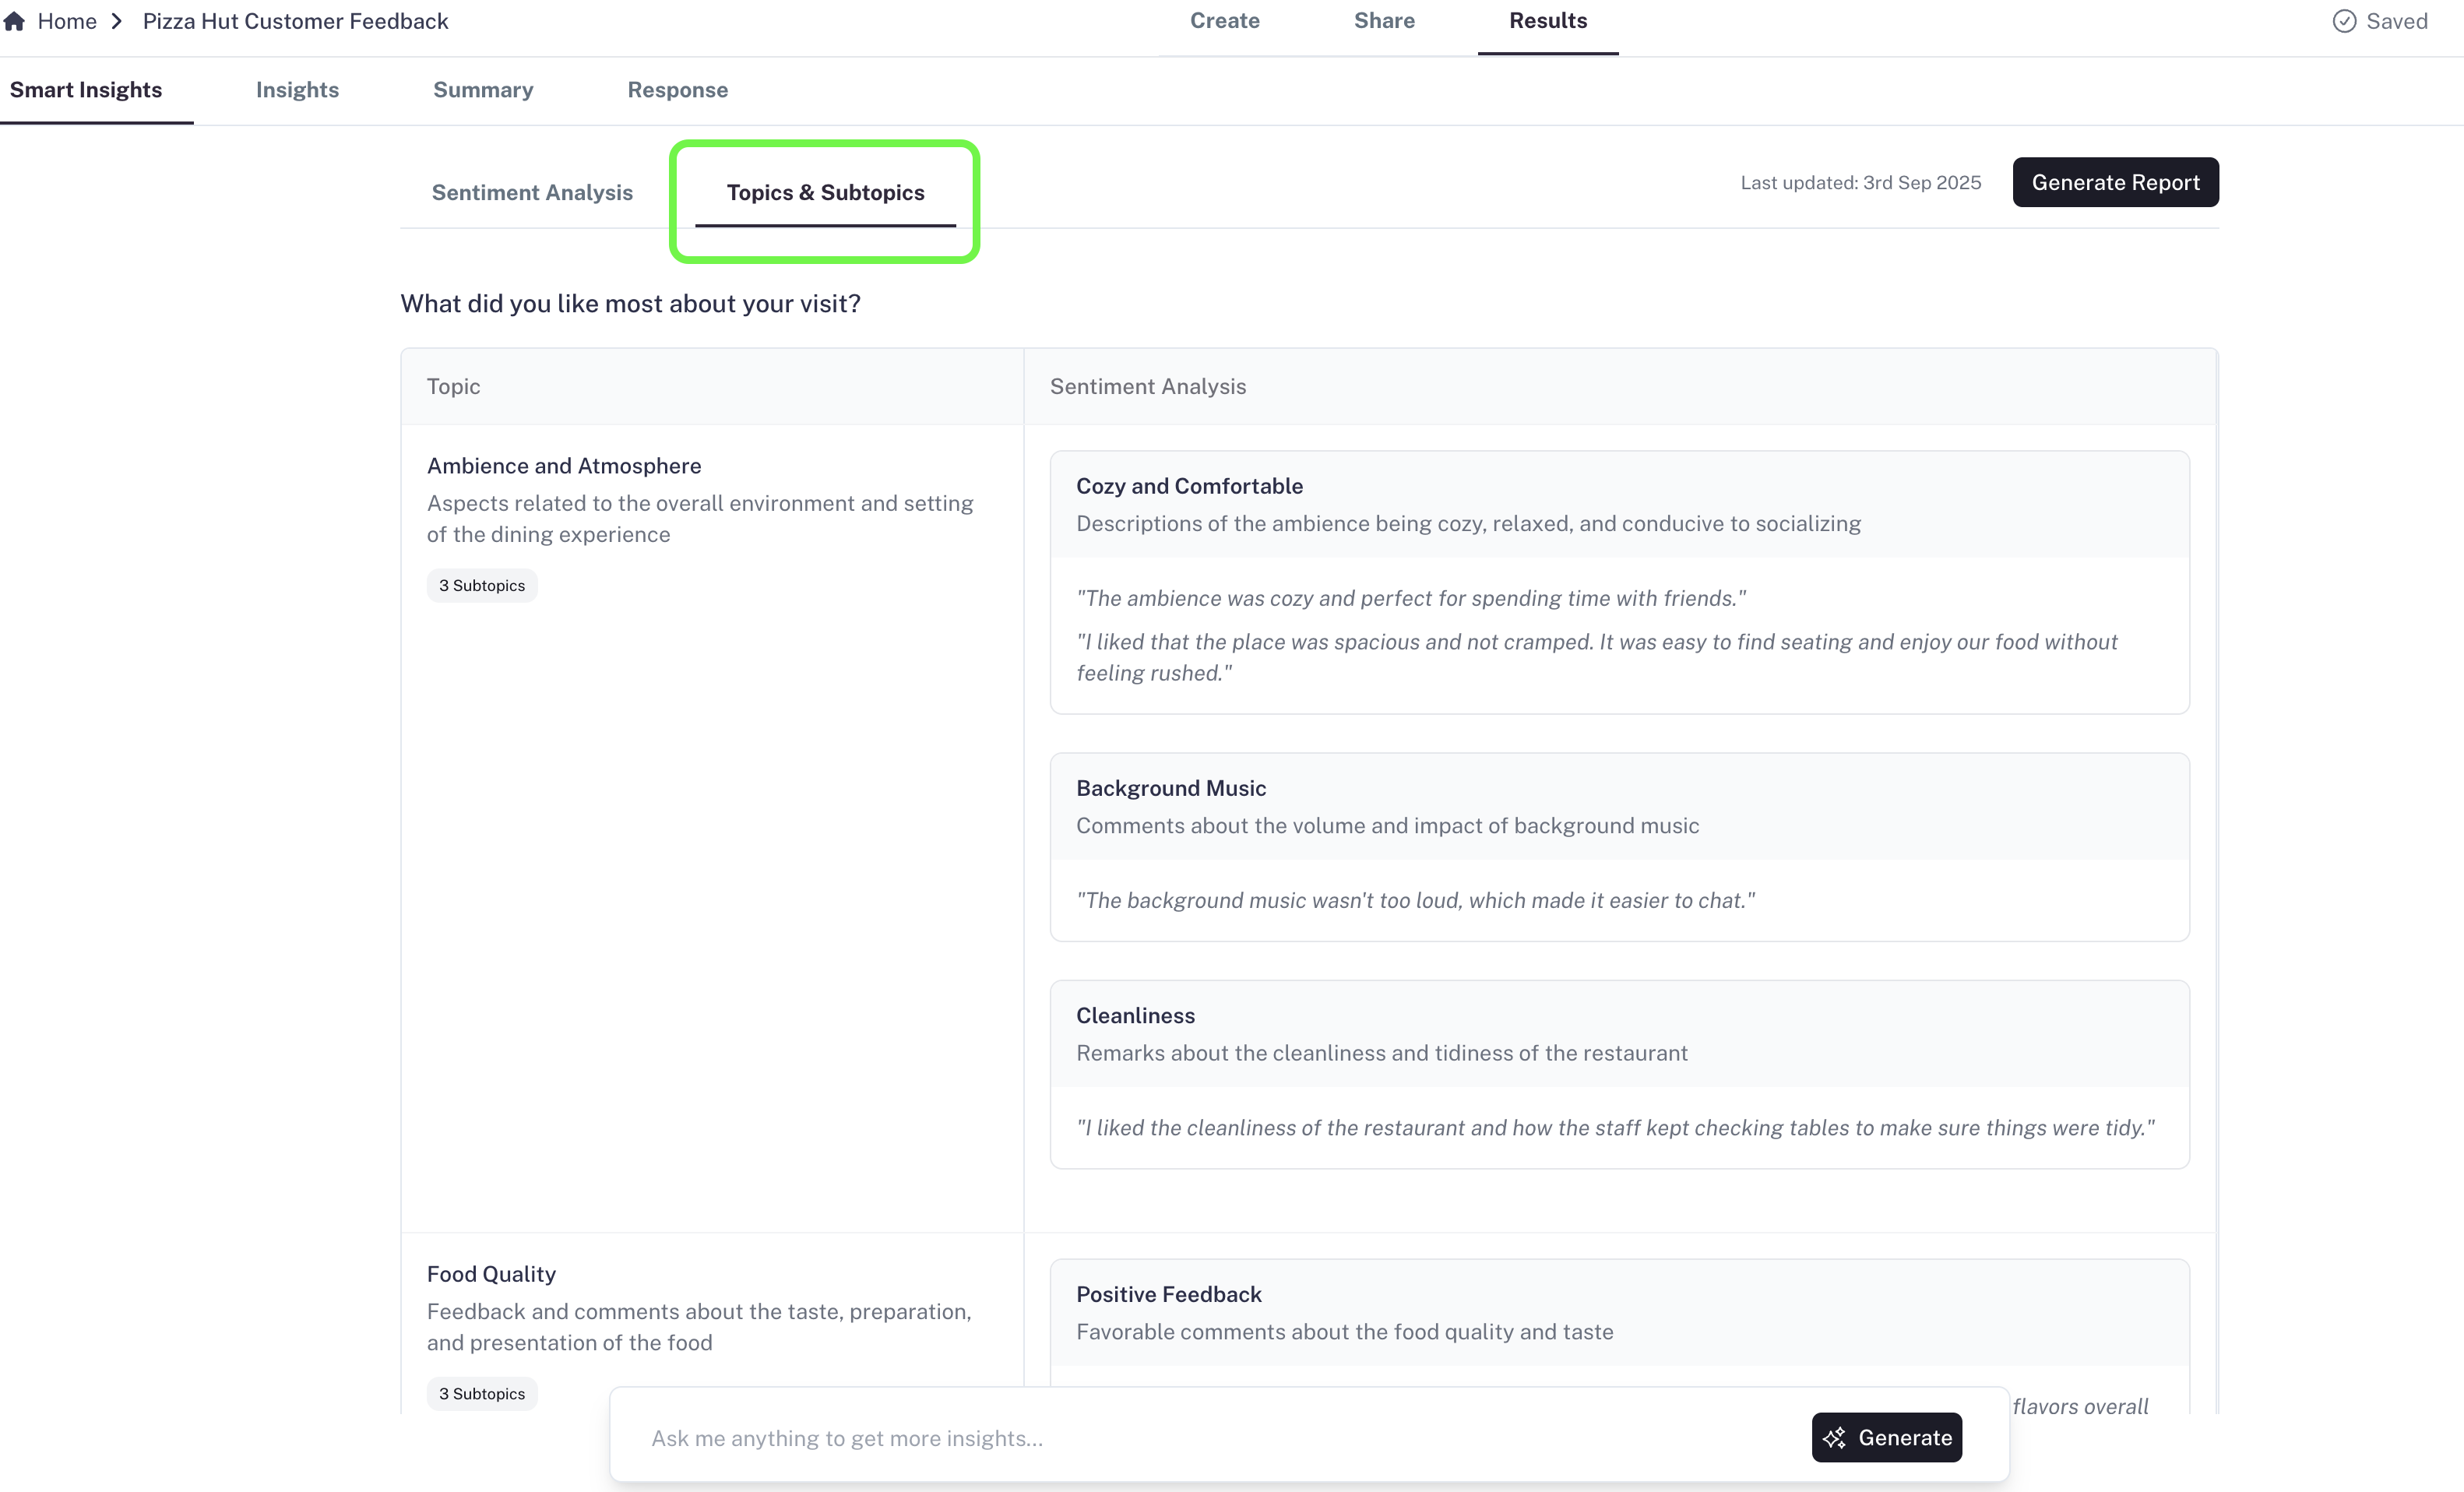
- Field Selection: The AI picks 2–3 of your text fields, again prioritizing Long Text fields. Each chosen field becomes a dedicated section in the analysis.
-
Structure of the Section:
For each selected form question:
- The question itself is displayed at the top.
- Below it, a table with two main columns appears:
- Main Topics: The AI identifies recurring themes (most frequently mentioned ideas or issues).
- Subtopics: Each main topic is broken down into 2–3 supporting points for deeper context.
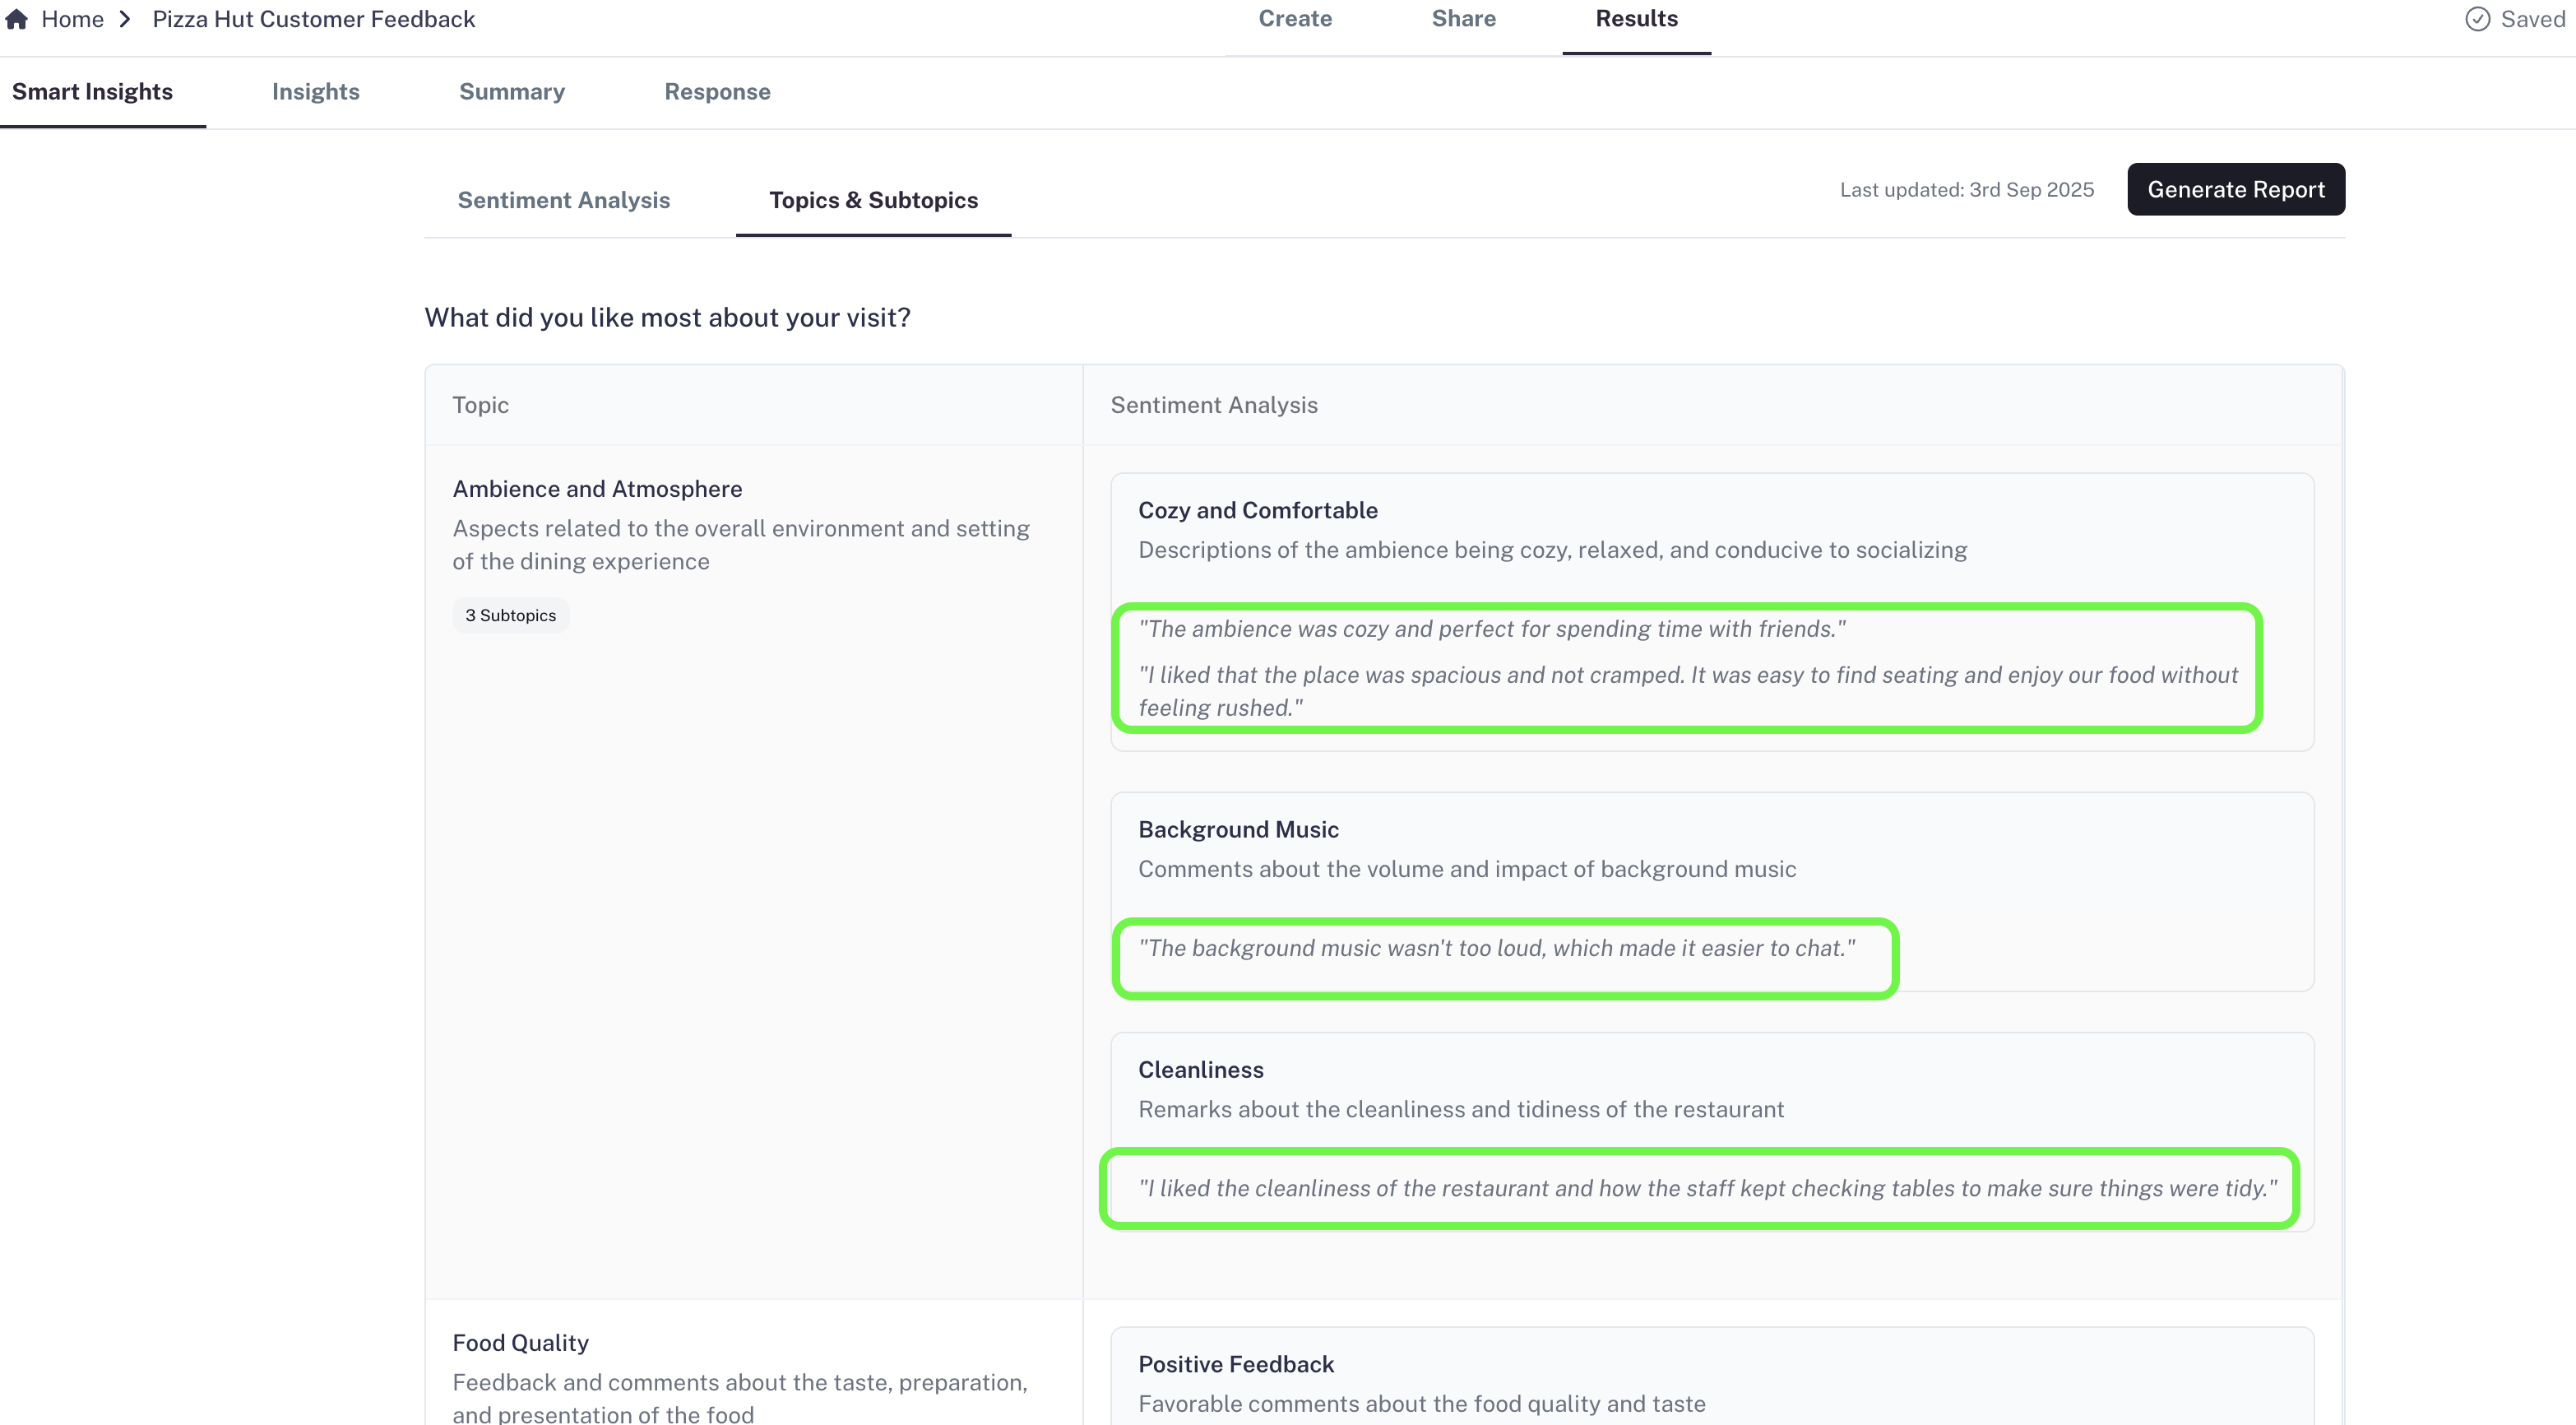
- Example Phrases: To give you direct evidence, the AI includes sample quotes from actual responses (shown in double quotes). These are verbatim user phrases, so you know exactly how people expressed their thoughts.
-
Value for You:
This layered view ensures you don’t just know what the big issues are, but also what specific details people are repeatedly highlighting.
- Example: If the main topic is Customer Support, the subtopics might be response time, friendliness, and issue resolution. Quotes like “had to wait 3 days for a reply” or “support team was polite” give you real context behind the numbers.
Why It’s Useful
Whether you’re handling dozens or hundreds of open-ended responses, Smart Analytics gives you a clear summary of sentiment, topics, and details that would otherwise take hours to uncover manually. It ensures you don’t miss important insights hidden in long text responses.Availability
Smart Analytics is a paid feature available only in the:- Growth Plan
- Professional Plan